群里又有人转那张图:横轴是模型发布日期,纵轴是“AI 能独立完成多长的软件任务”,点一路往右上爬。配文是:“GPT-4 只能干 4 分钟的活,现在已经是小时级了,每几个月翻一倍,照这个速度……”下面一排人开始掐指头算,AI 哪年能干完一周的活,哪年能干完一个月的。
这是 METR 的时间跨度(time horizon)曲线,过去一年大概是 AI 圈被转得最多的一张图。《纽约时报》拿它比摩尔定律,有人拿它比记录二氧化碳浓度的基林曲线,呼吁 AI 放慢的人也拿它当论据。
我的判断:这条曲线大体没画错,错的是纵轴的单位。“分钟”看上去是匀速的刻度,其实中间有一段是软的:从 3 分钟到 30 分钟的十倍很便宜,从 30 分钟到 5 小时的十倍才贵。拿“每 N 个月翻一倍”去推 AI 哪年能干一周的活,是在一把没校准过的尺子上画延长线。
证据来自 UC Berkeley 统计系 Drew T. Nguyen 和 William Fithian 的 《On the estimation and validity of AI time horizons — a statistical look at the METR plot》(arXiv:2610.12466,2026-10-08)。他们用 METR 的公开数据(Time Horizon 1.1:228 个任务、79 个任务族、26 个 AI,一直到 2026 年 5 月的 Claude Mythos)把这张图重算了一遍。
这把尺子是怎么做出来的
METR 先给每个任务定一个“人类耗时”:找专业软件工程师来做,每个任务大约 4 次尝试,取成功那几次耗时的几何平均。然后让每个 AI 在每个任务上重复跑,找出它有 50% 把握做成的那个任务长度,这就是它的“时间跨度”。比如 GPT-4 的估计值是 4 分钟:人类 4 分钟能做完的活(像“查一下某个事实”),它大约一半时候能独立做成。
关键的假设藏在拟合方式里:AI 觉得一个任务有多难,和人类耗时的对数成直线关系。人类多花一倍时间,AI 那边的难度就固定涨一格,处处一样。
2 到 30 分钟,尺子是平的
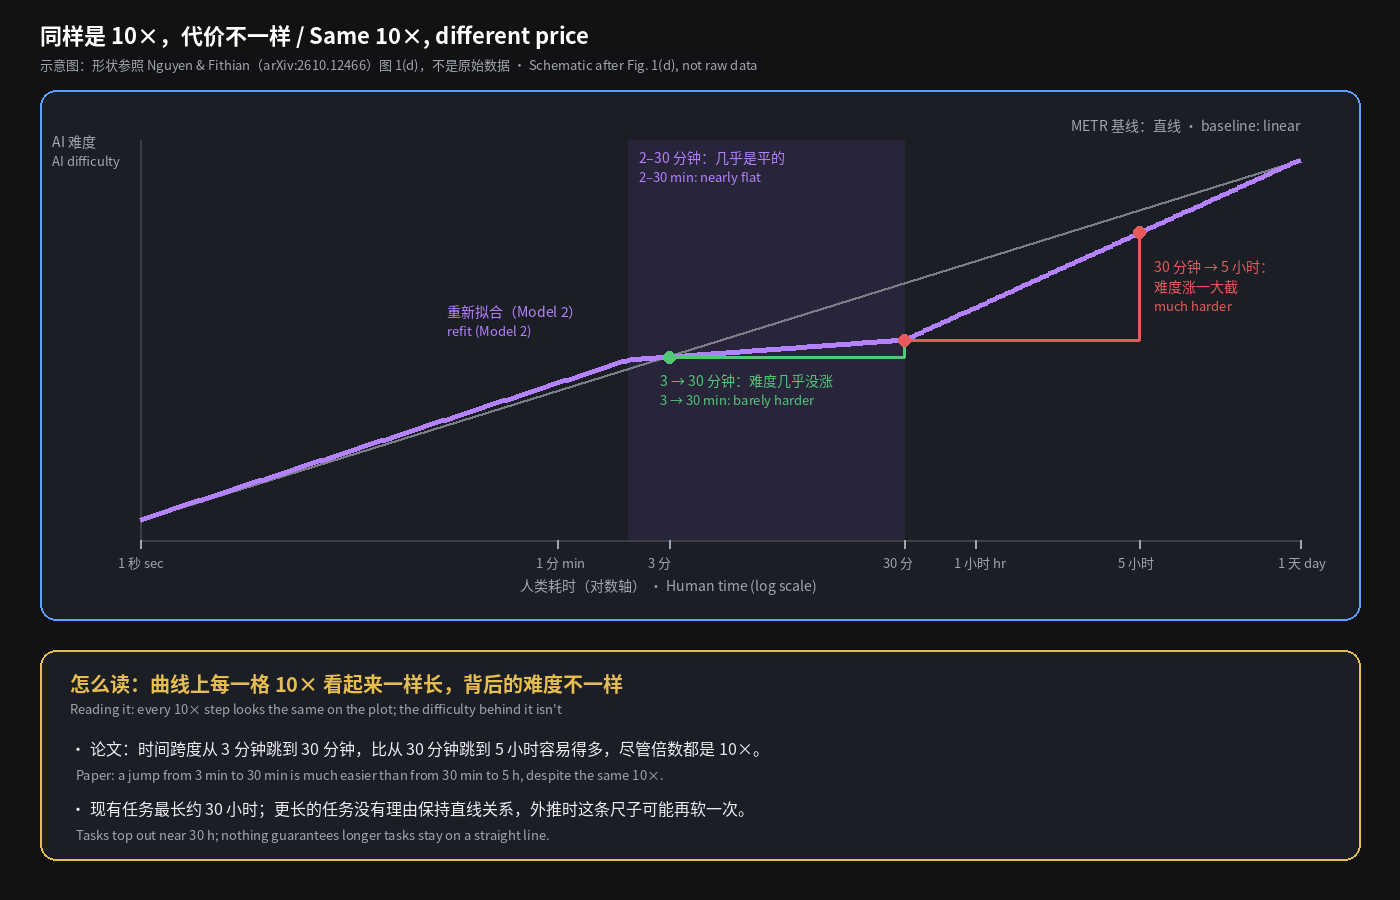
作者把这条直线换成单调样条,又做了一个带任务族效应、允许重复运行相关的 IRT 模型(文中叫 Model 2),让数据自己说“人类耗时 → AI 难度”长什么样。结果是:大部分区间确实接近直线,但 2 到 30 分钟这一段几乎是平的。人类要花 3 分钟和要花 30 分钟的任务,对 AI 来说难度差不多。
后果就是论文摘要里那句话:时间跨度从 3 分钟跳到 30 分钟,比从 30 分钟跳到 5 小时容易得多,尽管倍数都是 10×。按固定任务长度看成功率,跨度 4 分钟的 AI 和跨度 15 分钟的 AI,在每一个长度上的差距都比其他跳跃小得多。
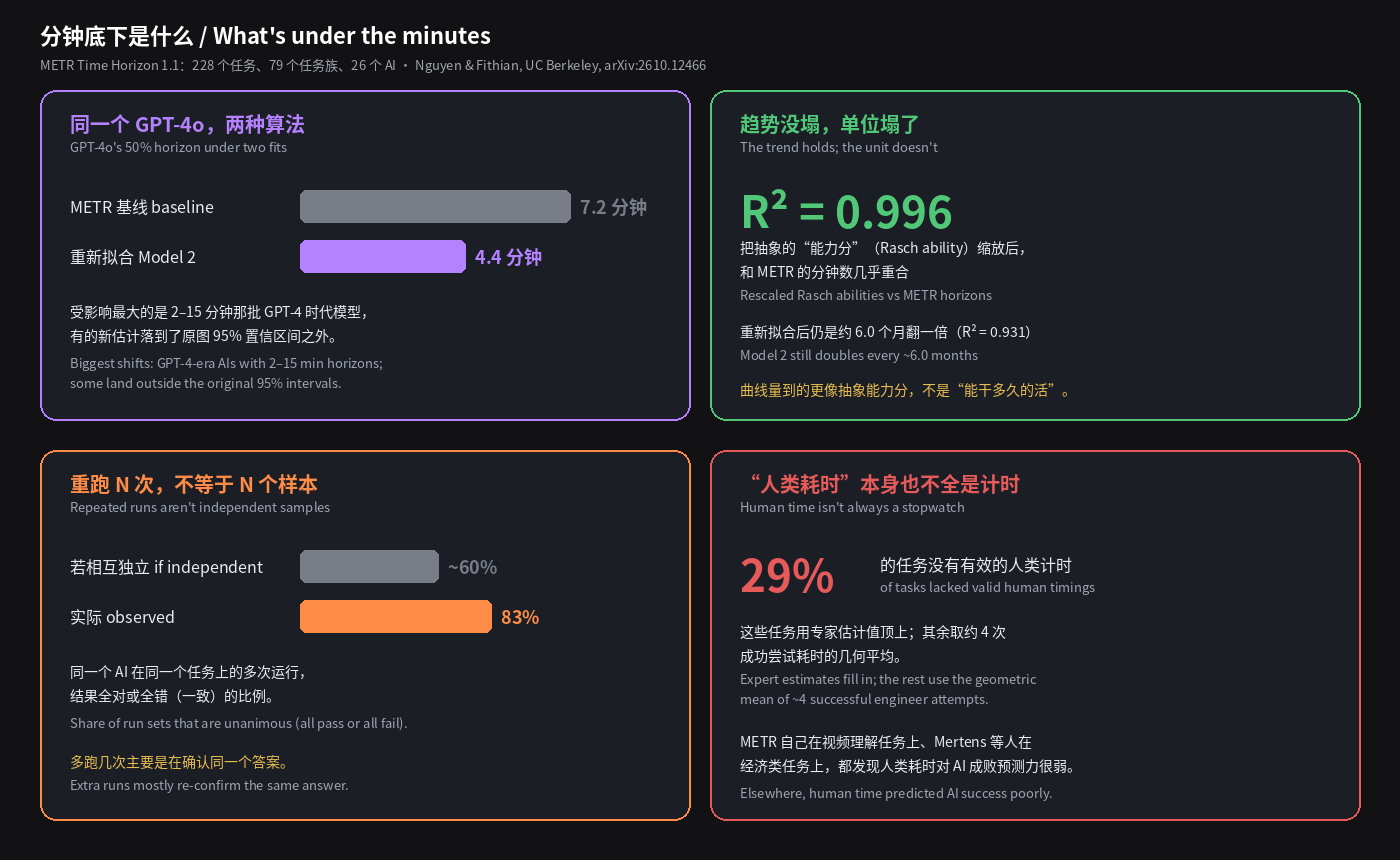
落到具体模型上:GPT-4o 的 50% 跨度,METR 的基线方法算出来是 7.2 分钟,新模型算出来是 4.4 分钟。改动最大的是跨度在 2–15 分钟的那批 GPT-4 时代模型,有的新估计落到了原图 95% 置信区间之外。在 5 折交叉验证的 12 项打分规则上,作者两个新模型的点估计全部优于基线。
换句话说,图上 GPT-4 时代那几步看起来很陡的爬升,有一部分是尺子在这一段太软造成的。
趋势没塌,塌的是“分钟”这层意思
这里得说句公道话,免得这篇被当成“METR 图是假的”来转。
论文没有挑战指数增长本身:用新模型重算,依然大约 6.0 个月翻一倍(R² = 0.931)。更耐人寻味的是另一个发现:把模型里那个抽象的“能力分”(Rasch ability)缩放一下画上去,和 METR 原来的分钟数几乎完全重合,R² = 0.996。
作者的解释是:直线模型名义上在估“能干多长的活”,实际上可能是在不经意间估了另一个东西,一个抽象的能力分。因为平的那段只集中在 2–30 分钟,放到整套任务上直线假设还算够用,所以趋势和先后顺序都没错。但他们的话说得很直接:如果你相信这条转换曲线不是直线,就不该再把这个估计叫做“时间跨度”。
所以更准确的读法是:METR 曲线证明了 AI 的能力分在稳定地、指数式地涨;它没有证明“AI 能独立干的活的时长”在以同样的速度涨。 前者是一把能力尺,后者是一个承诺。转图的人几乎都在转后者。
外推,恰好是最软的地方
现在任务库里最长的任务大约 30 小时。作者指出,没有任何先验理由保证更长的任务会延续直线关系,往后可能又冒出一段异常平或异常陡的区间,而只检查直线模型是发现不了的。“明年能干一周、后年能干一个月”,恰恰是在数据没覆盖、尺子也没校准过的地方画延长线。
还有几件事让“分钟”更软:
- 29% 的任务没有拿到有效的人类计时(测不出来,或者成功次数太少),用的是专家估计值。
- 同一个 AI 在同一个任务上重跑多次,如果每次真是独立的,大约 60% 的结果会全对或全错;实际是 83%。多跑几次,大多是在确认同一个答案,信息量没有次数看上去那么多。
- 换个领域,这把尺子可能直接不灵:METR 自己在视频理解任务上发现人类耗时和 AI 成败的相关性很低;Mertens 等人在大量经济类任务上也发现预测力很弱。
这跟你有什么关系
你多半不会去重算 METR 曲线,但你很可能在做它的缩小版:给自家 Agent 跑一组内部任务,算个通过率或者“能做多大的活”,然后拿去说服老板、排预算、估人手。两个坑一个不少:任务“大小”的刻度不是匀速的;重跑次数不等于样本数。
能马上做的一步:把你的评测结果按人类耗时分桶,看每一桶的成功率,再看重跑的一致率。 准备一个 runs.csv,三列 task,human_minutes,success(每次运行一行,success 为 0 或 1):
import csv, math, collections
by_task, mins = collections.defaultdict(list), {}
for r in csv.DictReader(open("runs.csv")):
    by_task[r["task"]].append(int(r["success"])); mins[r["task"]] = float(r["human_minutes"])
bins = collections.defaultdict(list)
for t, ys in by_task.items():
    bins[4 ** round(math.log(mins[t], 4))].append(sum(ys) / len(ys))  # ~1, 4, 16, 64 ... min
for b in sorted(bins):
    v = bins[b]; print(f"~{b:>6g} min  tasks={len(v):3d}  success={sum(v)/len(v):.0%}")
multi = [ys for ys in by_task.values() if len(ys) > 1]
if multi: print(f"unanimous run sets: {sum(len(set(ys)) == 1 for ys in multi)/len(multi):.0%}")
相邻几个桶的成功率如果差不多,说明在这一段“任务变长”对你的 Agent 并不更难,别在这一段上宣布进步;一致率如果很高,重跑 5 次不如多加 5 个不同的任务。
下次再看到“跨度又翻了一倍”,问一句:在固定长度的任务上,比如 1 小时、4 小时,成功率分别从多少涨到了多少?这是论文建议的读法,比一个 50% 跨度诚实得多。
一句话:METR 曲线是一把好的能力尺,不是一块好的秒表。拿它比谁更强没问题;拿它算 AI 哪年能替你干一周的活,就是在用秒表量一段它从没校准过的距离。
Someone in the group chat posts that chart again: release date on the x-axis, "how long a software task an AI can finish on its own" on the y-axis, dots climbing to the upper right. The caption: "GPT-4 could handle 4-minute jobs, now we're at hours, doubling every few months, at this rate..." And a row of people start counting on their fingers: which year can AI do a week of work, which year a month.
That's METR's time-horizon plot, probably the most forwarded chart in AI over the past year. The New York Times compared it to Moore's law, others to the Keeling Curve of rising CO2, and people calling for an AI slowdown cite it too.
My take: the curve is mostly drawn right. It's the unit on the y-axis that's wrong. "Minutes" look like an even scale, but the ruler is soft in the middle: the 10× from 3 to 30 minutes is cheap, the 10× from 30 minutes to 5 hours is the expensive one. Using "doubles every N months" to predict when AI does a week of work is extending a trend line on a ruler nobody calibrated.
The evidence is Drew T. Nguyen and William Fithian (UC Berkeley Statistics), "On the estimation and validity of AI time horizons — a statistical look at the METR plot" (arXiv:2610.12466, 8 Oct 2026). They refit the plot from METR's public data: Time Horizon 1.1, 228 tasks, 79 task families, 26 AIs, running up to Claude Mythos in May 2026.
How the ruler is made
METR first gives each task a "human time": professional software engineers attempt it, about 4 attempts per task, and the times of the successful attempts are combined with a geometric mean. Each AI then runs each task repeatedly, and its time horizon is the task length it completes with 50% probability. GPT-4's estimate, for example, is 4 minutes: on a task a human finishes in 4 minutes (like "Google this fact"), it succeeds on its own about half the time.
The key assumption hides in the fit: how hard a task is for an AI is a straight line in the log of human time. Every doubling of human time adds the same fixed step of AI difficulty, everywhere on the scale.
Between 2 and 30 minutes, the ruler is flat
The authors replace that straight line with a monotone spline, and add an item-response (IRT) model with task-family effects and correlated repeat runs (their Model 2), so the data decides what "human time → AI difficulty" looks like. Most of the range is close to linear. But the stretch from 2 to 30 minutes is nearly flat. A task that takes a human 3 minutes and one that takes 30 are about equally hard for an AI.
Hence the line in the abstract: a time-horizon jump from 3 minutes to 30 minutes is much easier than one from 30 minutes to 5 hours, despite the same 10× multiplier. Look at success rates at fixed task lengths and the AI with a 4-minute horizon and the one with a 15-minute horizon are much closer at every length than any other jump.
On concrete models: GPT-4o's 50% horizon is 7.2 minutes under METR's baseline method and 4.4 minutes under the new model. The biggest changes hit the GPT-4-era AIs with horizons of 2–15 minutes, and some new estimates fall outside the original plot's 95% confidence intervals. Across 12 proper scoring rules under 5-fold cross-validation, the point estimates of both new models beat the baseline on every one.
In other words, part of the steep-looking climb through the GPT-4 era comes from the ruler being soft right there.
The trend survives; "minutes" doesn't
To be fair, so this doesn't get forwarded as "the METR plot is fake":
The paper doesn't challenge the exponential growth. Refit with the new model, horizons still double roughly every 6.0 months (R² = 0.931). And there's a more interesting finding: take the model's abstract ability score (the Rasch ability), rescale it, and it lands almost exactly on METR's original minute values, R² = 0.996.
The authors' reading: the linear model claims to estimate "how long a task the AI can do", but it may be inadvertently estimating something else, an abstract capability score. Because the flat region is confined to 2–30 minutes, the straight-line assumption is good enough across the whole suite, so the trend and the ordering come out right. But they put it bluntly: if you believe the conversion curve isn't linear, you shouldn't call the estimate a time horizon.
So the accurate reading is: the METR plot shows AI ability scores rising steadily and exponentially. It does not show that the length of work AI can do on its own is rising at the same rate. The first is a capability ruler; the second is a promise. Nearly everyone forwarding the chart is forwarding the second.
Extrapolation is exactly where it's softest
The longest tasks in the suite are around 30 hours. The authors note there's no a priori reason longer tasks keep the linear relationship; another unusually flat or steep stretch could appear, and checks on a linear model won't detect it. "A week next year, a month the year after" is drawing the line precisely where there's no data and the ruler was never calibrated.
A few more things make the minutes softer:
- For 29% of tasks, valid human timings couldn't be obtained (unmeasurable, or too few successes), so an expert's estimate was used instead.
- When the same AI reruns the same task, independent runs would predict about 60% of run sets to be unanimous (all pass or all fail). The actual figure is 83%. Extra runs mostly re-confirm the same answer, carrying less information than their count suggests.
- In other domains the ruler may simply not work: METR itself found low correlation between human time and AI success on video understanding tasks, and Mertens et al. found weak predictiveness across a broad range of economically relevant tasks.
Why this is your problem
You probably won't refit the METR plot. But you're likely running a small version of it: an internal task set for your own agent, a pass rate or "how big a job it can handle", then used to convince your boss, set a budget or plan headcount. Both traps come along: the scale of task "size" isn't even, and rerun count isn't sample size.
One step you can run now: bucket your eval results by human time, check the success rate in each bucket, then check how unanimous your reruns are. Make a runs.csv with three columns, task,human_minutes,success (one row per run, success is 0 or 1):
import csv, math, collections
by_task, mins = collections.defaultdict(list), {}
for r in csv.DictReader(open("runs.csv")):
    by_task[r["task"]].append(int(r["success"])); mins[r["task"]] = float(r["human_minutes"])
bins = collections.defaultdict(list)
for t, ys in by_task.items():
    bins[4 ** round(math.log(mins[t], 4))].append(sum(ys) / len(ys))  # ~1, 4, 16, 64 ... min
for b in sorted(bins):
    v = bins[b]; print(f"~{b:>6g} min  tasks={len(v):3d}  success={sum(v)/len(v):.0%}")
multi = [ys for ys in by_task.values() if len(ys) > 1]
if multi: print(f"unanimous run sets: {sum(len(set(ys)) == 1 for ys in multi)/len(multi):.0%}")
If neighbouring buckets have about the same success rate, longer tasks in that range aren't actually harder for your agent, so don't announce progress there. If your reruns are highly unanimous, five more runs are worth less than five more distinct tasks.
Next time you see "the horizon doubled again", ask: on tasks of a fixed length, say 1 hour or 4 hours, what did the success rate go from and to? That's the reading the paper recommends, and it's far more honest than a single 50% horizon.
In one line: the METR plot is a good capability ruler, not a good stopwatch. Use it to compare who's stronger, fine. Use it to work out which year AI does a week of your work, and you're timing a distance the stopwatch was never calibrated for.